UofL's annual Carbon Emissions Report demonstrates need for renewed attention and investment
In accordance with our Carbon Commitment and membership in the Climate Leadership Network, the University of Louisville has just released our annual Greenhouse Gas Emissions Report (2018). While the process of estimating our net emissions is far from perfect, it is vital that we continue to measure what we have committed to managing – i.e. the reduction of our carbon emissions with the ultimate goal of achieving carbon neutrality by 2050 at the latest.

The bottom line: Following a troubling rise in 2017, our emissions essentially stabilized in 2018, decreasing by just 0.3%. This means UofL remains off track for achieving our first milestone goal of a 20% emissions reduction by 2020 from our 2008 baseline. In 2016, we appeared to be on track as we stood at a reduction of 18.7%. In 2018, we were back down to a 13% reduction overall. In order to achieve our 2020 goal, we must cut emissions another 8% in the next two years. This is ambitious but achievable if we reinvest in efficiency, renewable energy, and transportation demand management.
 Our efforts to implement our Climate Action Plan (CAP) had been paying off, thanks to sustained investment of resources and attention in fiscal years 2011-2017. However, a troubling reversal of progress occurred in FY18, when the university’s financial crisis resulted in a 100% budget cut for CAP implementation. In FY19, facing continued financial constraints, the CAP implementation budget was restored to a minimal operating level of $27,000 (15% of historical funding levels) and emissions leveled-off. This lack of investment has hindered our ability to take action to reduce emissions and raise awareness. A renewed investment of resources and leadership can get us back on track in the years to come.
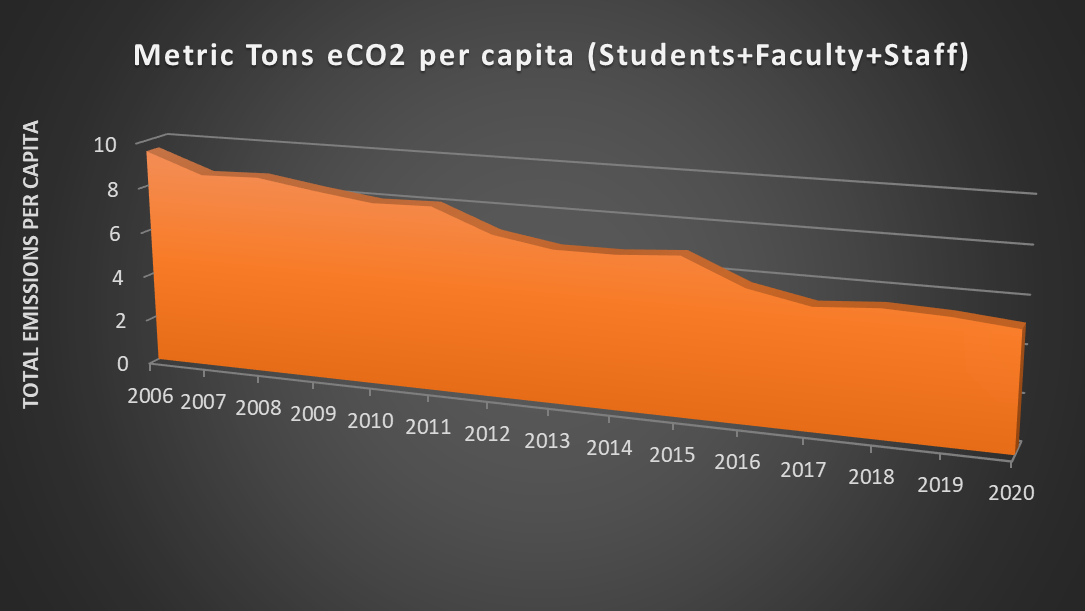
The good news is that, over the long-term, we have reduced carbon emissions, even as we continue to grow in terms of physical size, campus population, and budgetary expenditures. In fact, UofL has achieved the following relative reductions in emissions over time:
| Per sq. ft. of building space |
Per Capita (Students+Employees) |
Per Operating Budget Dollar |
|
|---|---|---|---|
| Emissions Reduction 2008-2018 | 32.6% | 21.8% | 47.7% |
In total, from 2008 to 2018, we estimate that UofL’s net carbon emissions declined by 13% from 218,540 to 190,141 metric tons/year. According to the EPA's greenhouse gas equivalencies calculator, each year this translates to:
- Taking 6,030 cars off the road, or 69,435,208 miles of driving, or 3,195,567 gallons of gasoline burned;
- 9,905 tons (or 1,415 garbage trucks) of waste recycled instead of landfilled;
- Emissions from 3,401 average U.S. homes’ annual energy use;
- 155 rail cars worth of coal burned;
- 1,078,702 incandescent lamps switched to LEDs; or the
- Carbon sequestered by 33,423 acres of U.S. forests in one year (or 469,583 tree seedlings grown for 10 years).
However, given that the social cost of carbon is at least $40/ton of carbon emissions, UofL's emissions in 2018 were still responsible for no less than $7.61 million/year in damage to our planet and its people. It is not acceptable to continue externalizing these costs and imposing such a debt on the future generations for whom UofL ought to be a source of hope and flourishing.
The most important steps that UofL needs to take in the near-term are:
- Invest in large-scale renewable energy, behavior change, and energy efficiency measures beyond the scope of the recent performance contract.
- Reduce driving through a Transportation Demand Management Plan that invests in and incentivizes alternatives, caps parking, and transitions UofL from highly subsidized annual parking permits to market-rate, pay-per-use parking that subsidizes alternatives.
- Explore carbon offsetting and sequestration solutions that would benefit our campus, community, and region.
Our heartfelt thanks goes out to the many people across the university who took time and care again this year to supply us with the data necessary to compile this report. They are acknowledged on page 2.
See also:
- University Of Louisville Falls Behind On Climate Change Goals (WFPL, July 2, 2019)
- Kentucky colleges have lofty climate goals but struggle to cut greenhouse emissions (Courier-Journal, July 8, 2019)


