Data and information for public about the CAEP reporting measures. Some of these are linked to websites, pdf documents, and other resources with pertinent data. While some of the websites provide interactive data, the users may be required to select different options to access up-to-date information. Additional information is also available on the University of Louisville’s Common Data Site (CDS) and the CARD Analytics Site.
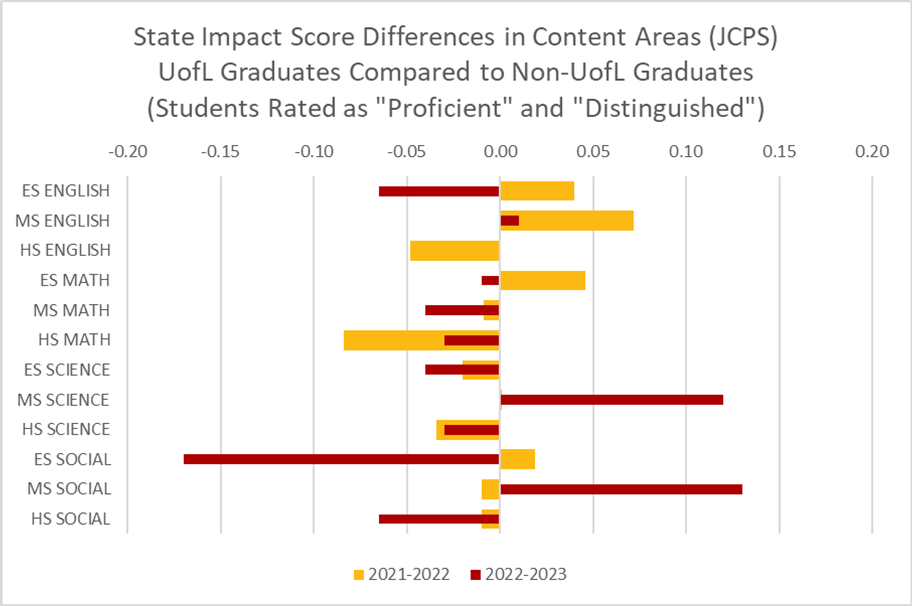
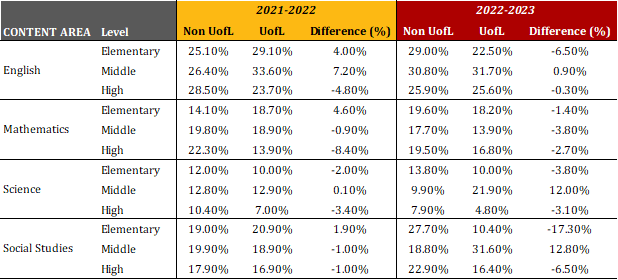
The Jefferson County Public School System (JCPS) is the largest employer of recent CEHD graduates. The State provides impact data showing completer contributions to P-12 student-learning growth. Essentially, UofL new initial teacher graduates’ students performance in English, Math, Science, and Social Studies are compared to other programs’ completers across three grade bands (Elementary, Middle, and High School). Students are rated as Novice, Apprentice, Proficient, or Distinguished.
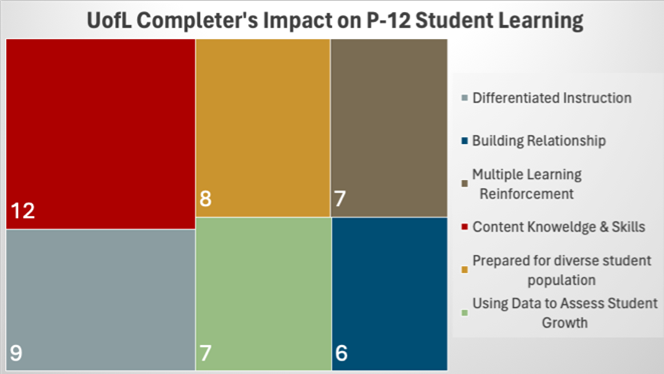
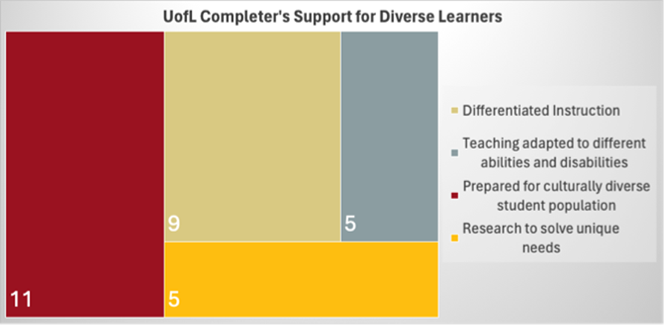
In addition to Impact Scores, UofL measures program completers’ effectiveness in applying professional knowledge, skills, and dispositions through the ongoing LEARn+ Project (Louisville Educator Alumni Reflections and iNsights). A broad range of alumni, school district leadership, employers, faculty, and community stakeholders are interviewed each semester to assess UofL graduates’ impacts on P-12 Learning. The emergent qualitative themes representing UofL completer strengths are documented in the frequency count tree maps below and a complete report can be downloaded here.
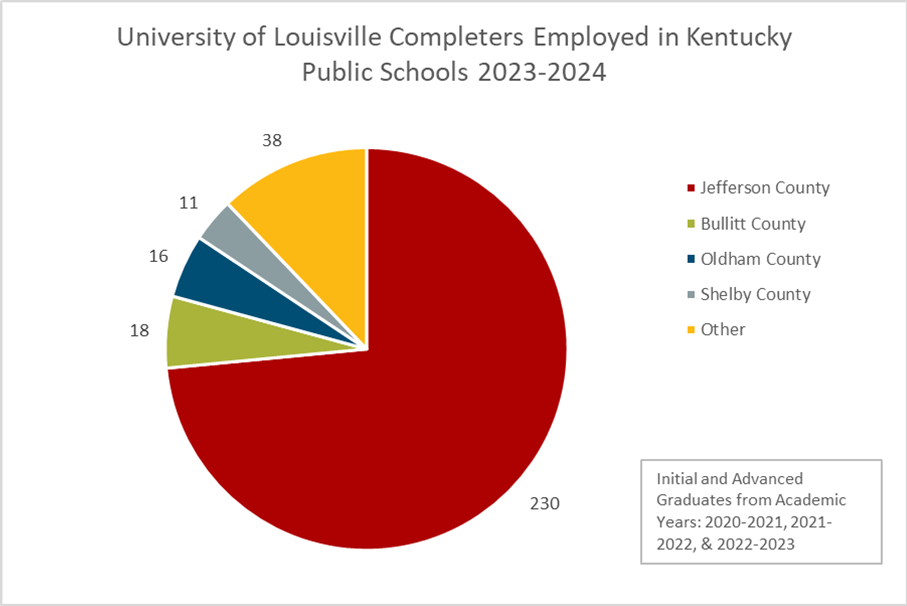
In Fall term 2023, over 300 UofL College of Education and Human Development completers who graduated between 2020-2021 and 2022-2023 were employed in Kentucky public schools. The top four districts are below.
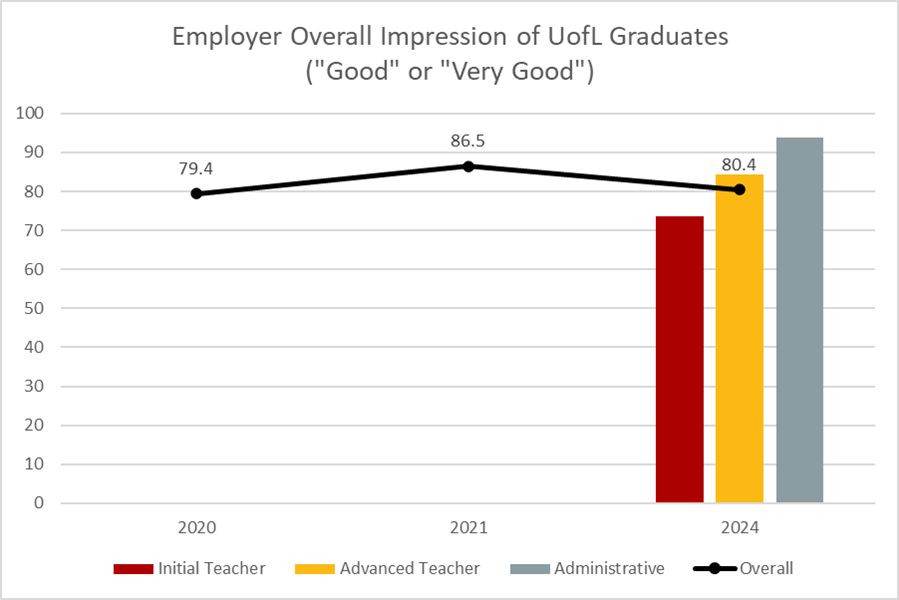
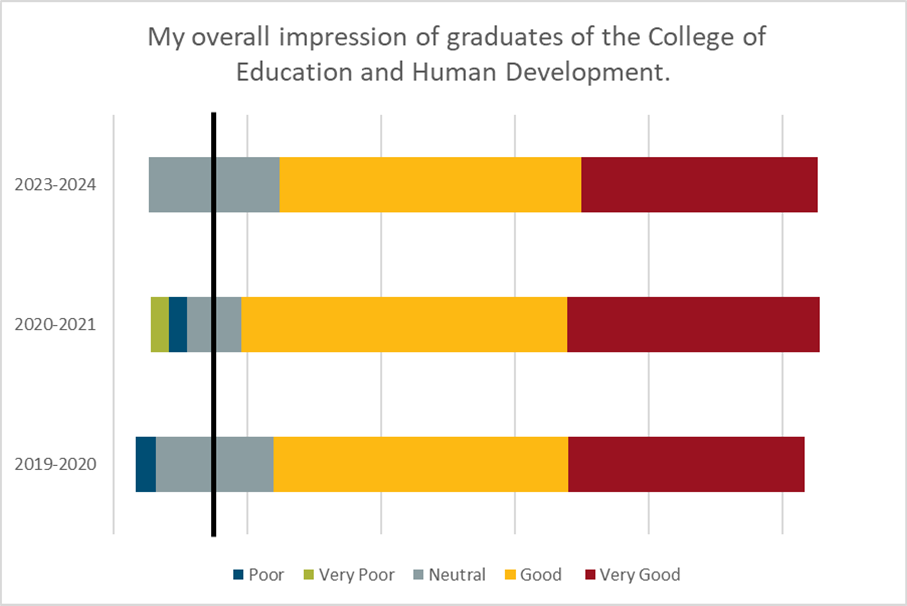
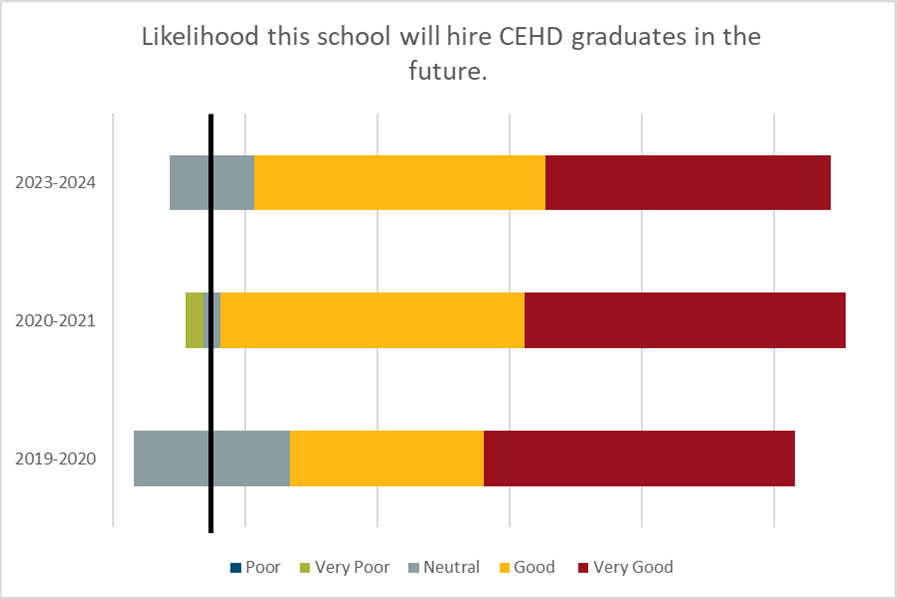
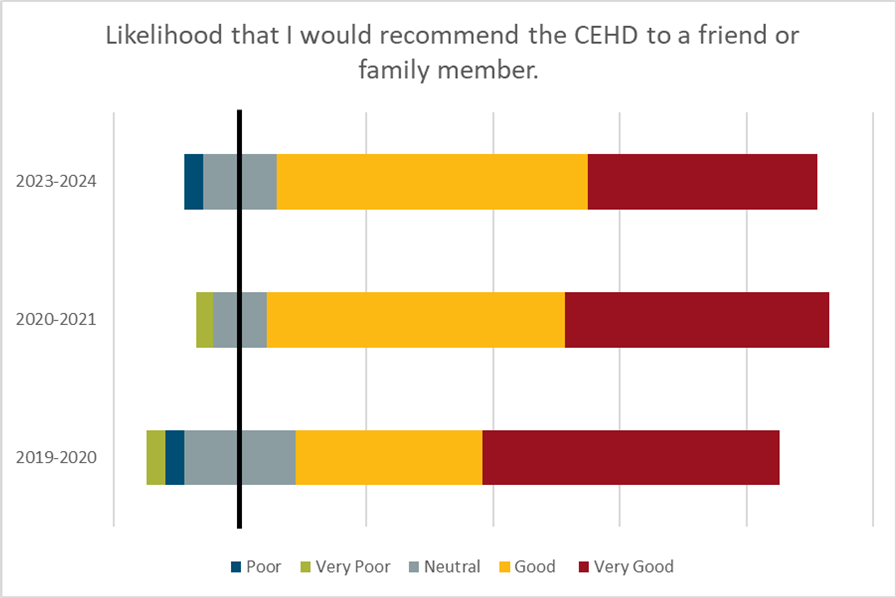
Additionally, employers of recent graduates are surveyed annually to ascertain their satisfaction with program completers. From this survey, employers’ overall satisfaction is tracked.
Candidate competency and readiness to meet state requirements for licensure at program completion are assessed by Praxis Exam pass rates, as reported on the Federal Department of Education Title II Report. Note, if there are fewer than 10 candidates taking an exam, the results are not reported. Data do not include endorsements or Rank programs, and not all programs leading to certification require a Praxis exam.
| 2020-2021 | 2021-2022 | 2022-2023 | |
|---|---|---|---|
Initial Program Completers | 170 | 189 | 156 |
Advanced Program Completers | 82 | 78 | 71 |
Number of Praxis Exams Reported | 179 | 182 | 142 |
Number of Praxis Exams Passed | 173 | 177 | 130 |
Percent Passing Rate | 96.6% | 97.2% | 91.5% |
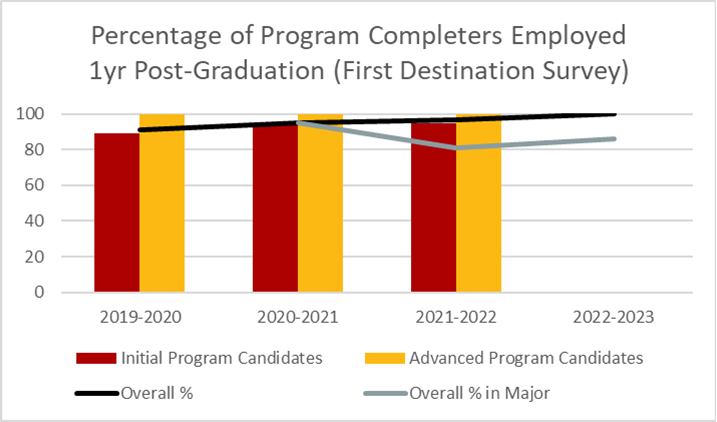
The CEHD assesses completer ability to be hired in positions for which they have prepared using the First Destination Survey conducted by the University of Louisville. For reporting purposes, “employed” includes candidates reporting they work full-time, part-time, choose to remain outside of the traditional workforce, or are serving as active-duty military. The complete distribution is found here.