Dashboard

Wastewater monitoring results for the current week in Louisville-Jefferson County

Wastewater Monitoring Results

Since June 2020 Louisville’s Metropolitan Sewer District (MSD) and Louisville Metro Public Health and Wellness (LMPHW) have partnered with researchers from the University of Louisville's Envirome Institute to learn how sewage may indicate community health risk. We have collected thousands of samples from sewers from across Louisville looking for SARS-CoV-2, the virus that causes COVID-19. Together with county level clinical data, our sewers are helping us to understand how infection rates are related to important clinical indicators like new hospitalizations and ICU bed capacity.

Wastewater Levels, Hospital Admissions, and Occupied ICU Beds (03/24/2023)

In the charts below, we show overall SARS levels across Louisville and compare wastewater levels to two hospital indicators, new admissions and occupied ICU beds. The orange, yellow, and green bars in the last two charts show CDC designated risk thresholds. For this report, wastewater was collected on 02/28/2023 and the hospital metrics are based on CDC reporting for the week beginning 02/27/2023.  

  This graph shows the overall levels SARS-CoV-2 found in wastewater at Louisville's five Water Quality Treatment Plants.  

 This graph compares wastewater results to new hospital admissions for people infected with COVID-19 as reported to Louisville Metro Department of Public Health and Wellness. This week Louisville in in the yellow zone of medium risk as assessed by the Centers for Disease Control (CDC) for new hospital admissions. See the chart below for more information about the CDC's risk thresholds. 

This chart shows a comparison between wastewater results and ICU Bed Occupancy as reported to Louisville Metro Department of Public Health and Wellness. This week Louisville in in the green zone of low risk as assessed by the Centers for Disease Control (CDC). See the chart below for more information about the CDC's risk thresholds. 


Normalized Virus Concentration Graphs

Below you will see graphs that take endemic levels of SARS-CoV-2 into account. Endemic means a disease or illness commonly occurs in an area. It can be considered to be a "normal" level of a particular sickness in a community. To show this, we have compared current SARS wastewater concentrations to two other time periods within the past year. The first period is from March 2022, this is the time when Louisville had the fewest COVID-19 related hospitalizations happening (with 534 new hospital admissions weekly and 423 occupied ICU beds). This view is shown in the first graph. The second time period is from July 2022, this is the time when Louisville saw the most COVID-19 related hospitalizations happening (with 1,747 new hospital admissions weekly and 940 occupied ICU beds). This view is shown in the second graph.  

Current levels of wastewater SARS-CoV-2 concentration in Louisville is approximately 5x greater than the period when the fewest hospitalizations occurred for the past year.

Current levels of wastewater SARS-CoV-2 concentration in Louisville is approximately 60% lower than the period when the most hospitalizations occurred for the past year.


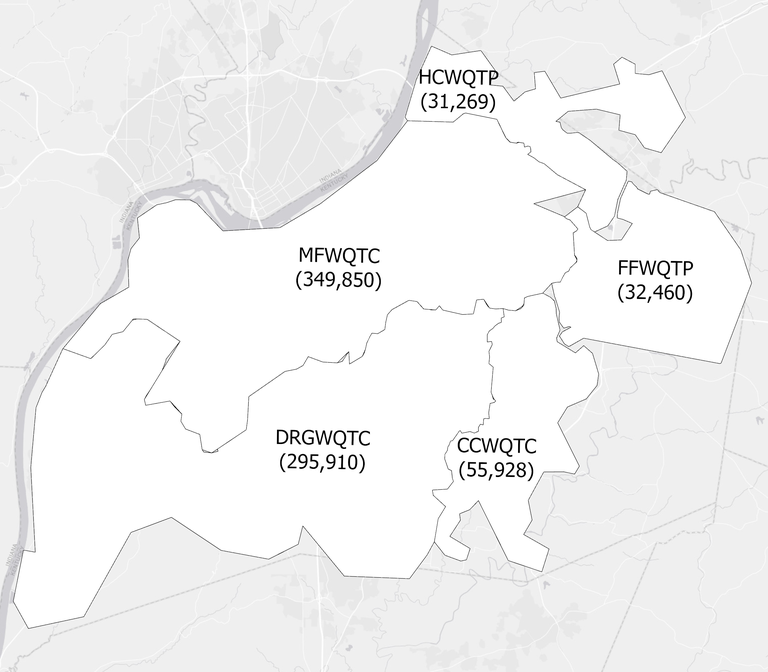
Louisville Sewersheds

We sample from 5 water quality treatment plants weekly. The three graphs on this page that show wastewater results are based on the average values for all 5 treatment centers.  


You can view additional wastewater data at the CDC's COVID Data Tracker.


Contact

For more information, send us an email at